Uncovering the struggle between buyers and sellers, candlestick patterns are a highly effective way of determining the direction in which the share price is likely to move in the near future. Here we discuss how a candlestick is formed, what each of the different patterns mean, and how they can be used to help inform your trading strategy.
What determines the shape of each candlestick?
Each candlestick is constructed based on the following: the highs and lows of the time period (the wicks), as well as the opening and closing price of that period (the body). As depicted below, the colour of the candlestick is dependent on whether or not the opening price was higher or lower than the closing price.
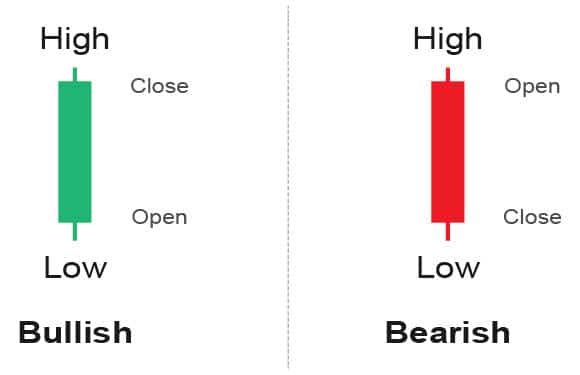
Where the stock closes in relation the the range provides valuable insight as to the struggle between buyers and sellers. For instance, when the stock closes at the bottom of the range, we can conclude that the sellers were in control, acting more aggressively to get out at any price. Alternatively, when the stock closes at the top of the range, we can conclude that the buyers were in control, acting with more fervour to get in at any price.
This jostling between buyers and sellers can result in a large number of differently sized candlesticks, but broadly speaking these can be classified as either wide range candles or narrow range candles. Wide range candles indicate high volatility, and narrow range candles indicate low volatility.
With regards to wide range candles, these often signal important changes in investor sentiment. Moreover, by the stock tending to move in the direction of such candles, these formations on the chart are useful for identifying possible reversals – providing the move was opposite to the current trend.
A word to the wise, though, it is important to factor in the trading volume behind any significant move in share price.
Which candlestick patterns are considered bullish?
There are dozens of different patterns with fancy names that supposedly indicate bullish sentiment. What really matters beyond memorising these, though, is understanding for yourself what each candle represents in terms of the struggle between buyers and sellers.
Not only this, it is also important to remember that to be considered a bullish reversal there should already be an existing downtrend. A bullish harami, for example, at new highs could hardly be considered a reversal pattern. Instead, such a formation could indicate continued buying pressure and represent a possible continuation in the trend. To help determine the trend, indicators such as the moving average are important.
With all of that said, let’s look at a selection of the most popular bullish candlestick patterns:
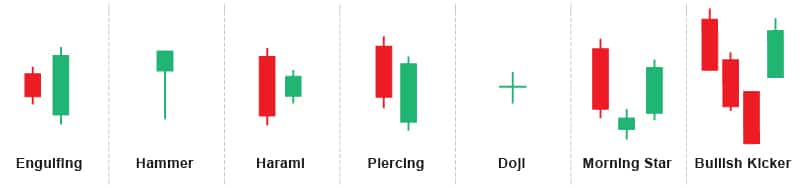
Engulfing: This pattern consists of two candles: the first is a narrow range candle that closes down for the day, indicating that the sellers are in control but not acting that aggressively; and the second is a wide range candle that ‘engulfs’ the body of the first and closes near the top of the range, strongly suggesting that the buyers are ready to take back control.
Hammer: The hammer patterns depicts how during a given period sellers took control of the stock, pushing it lower and lower; however, by the end of the period, buyers had overcome this pressure with enough strength to close at the top of the range, thus rejecting the price from dropping even lower and in fact ensuring it finishes above where it started.
With this type of pattern, the longer the shadow, the shorter the upper shadow, and the smaller the real body, the more meaningful and significant the hammer is believed to be. On top of this, if preceded by at least three declining candles in a row, the hammer is deemed to be even more likely to indicate a possible reversal.
Harami: Most notably with this pattern is that it gaps up on the second day, meaning that the price is now being held up and unable to move back lower to the bearish close of the previous day. This pattern indicates that the preceding momentum has stopped and that the buyers have taken back control.
Piercing: Providing there is a clear downtrend preceding the formation of this pattern, the piercing candlestick pattern can be considered bullish so long as the second candlestick closes above the previous day’s midpoint. The fact that the gap down at the opening of the second day was rejected by the bulls, and that the bulls were able to press even further up into the losses of the previous day, adds to this bullish sentiment, suggesting a possible reversal in the stock.
Doji: Possibly the most popular candlestick pattern to trade, the doji candlestick on a stock chart depicts a time period in which the stock opens and closes at or near the same price point. A long-legged doji is the same as a doji but with longer upper and lower shadows.
In terms of how dojis can be considered bullish, so long as it forms after an extended downward trend, it can be translated as representing indecision amongst traders, causing them to question the prevailing trend. Whilst it could always be a period of resting before a further continuation downwards, the doji often signals a reversal in trend.
Morning Star: The morning star consists of three candlesticks: a large bearish candle on day one; followed by a gap down on day two indicating that the bears remain in control but appear unable to push the price down much further than the open, resulting in a small bullish or bearish candle at the end of the day; followed by a gap up at the start of day three, which eventually results in a large bullish candle by the end of the day.
Bullish kicker: Another pattern considered relatively reliable is the kicker. Here after three or more days of the stock closing down in price, the stock gaps up to open at or above the previous day’s open, showing a very strong shift in sentiment and little hesitation amongst buyers.
Which candlestick patterns are considered bearish?
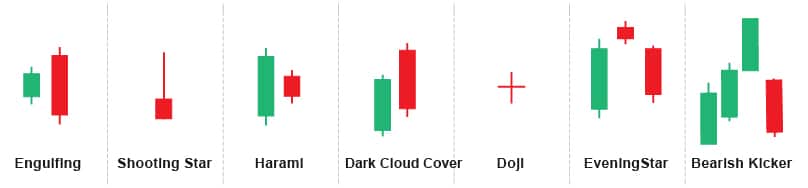
If you look closely, you’ll notice that these are pretty much the opposite of the bullish patterns but with different names. As such, there is little point in going through each of them again. Again, to be considered as a sign of a bearish reversal, these patterns need to form after a continued upward trend.
What to remember when it comes to candlestick patterns?
Rather than memorising all of the different patterns out there, understand for yourself what each candle represents in terms of the struggle between buyers and sellers. Using this logic, I would suggest keeping a journal where you predict the direction in share price of a selection of stocks, which you review on a daily or weekly basis to see if you were correct. Nothing will improve your technical trading strategy as much as this.
When reading candlestick patterns, make sure to look for patterns that signal traders rejecting certain price points, or that suggest momentum is faltering or a degree of indecision is creeping into play. Also, make sure to review price action in different time periods, such as comparing the day as a whole versus the last few hours of trading. On top of this, factor in the strength of the prevailing trend, as well as the level of trading volume to really understand the significance of any narrow or wide range candles.
Leave a Reply